
Have you ever felt like you're throwing spaghetti at the wall with your product-led growth strategy? You know it's working (users love your product), but proving its ROI can be a challenge.
Product-led growth (PLG) relies on your product to drive user acquisition, activation, and retention. But unlike traditional marketing, measuring success can be complex.
This guide cuts through the complexity and provides a roadmap to help you evaluate your PLG strategy and ensure you're on the right track.
Here's a breakdown of our agenda:
- How to measure product-led growth?
- Key metrics to track for product-led growth
- Real-Life examples
- FAQ
How to measure product-led growth
A product-led strategy can be extremely beneficial to SaaS companies who are looking to grow sustainably, but all of that counts for exactly nothing unless you know how to measure the success of your product-led strategy. The answer? Product-led metrics.
Here, we break down the key metrics you need to monitor with vigilance in order to see your product-led strategy soar.
Key metrics to track for product-led growth
Key Performance Indicators (KPIs) reveal not only user interactions but also the effectiveness of your product-led growth strategy.
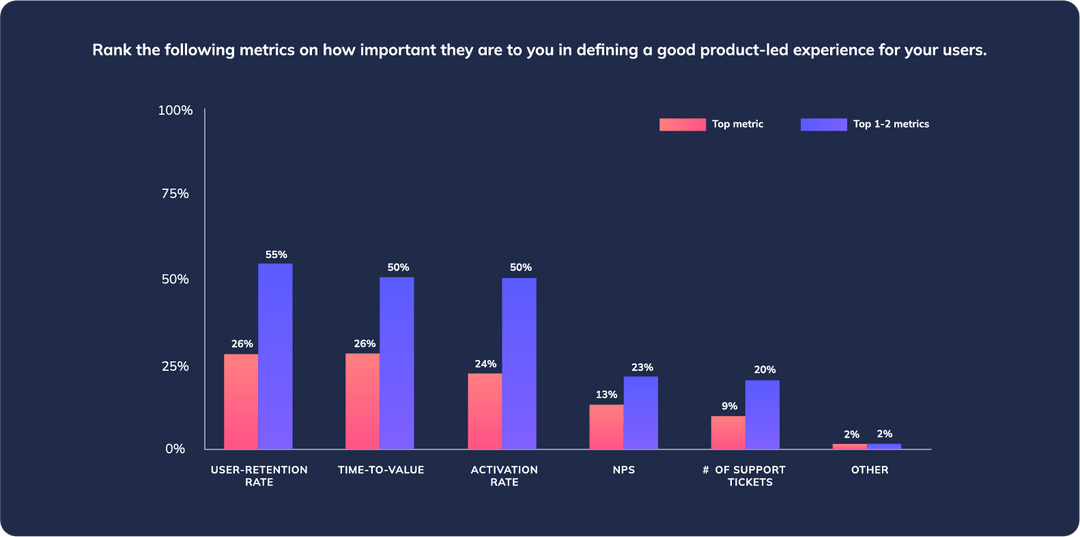
According to a survey by Appcues involving 350 SaaS professionals, the most important KPIs for a good product-led experience are:
- user retention rate
- time-to-value,
- and activation rate
Retention Rate
Retention rate measures the percentage of users who continue to use your product over a specific period. A high retention rate indicates that users find value in your product and are likely to stick with it.
To measure your retention rate, calculate the percentage of users who continue to use your product regularly over different timeframes (e.g., weekly, monthly, or annually).
If you start with 100 users at the beginning of the month and 90 of them are still using the product at the end of the month, your monthly retention rate is 90%.
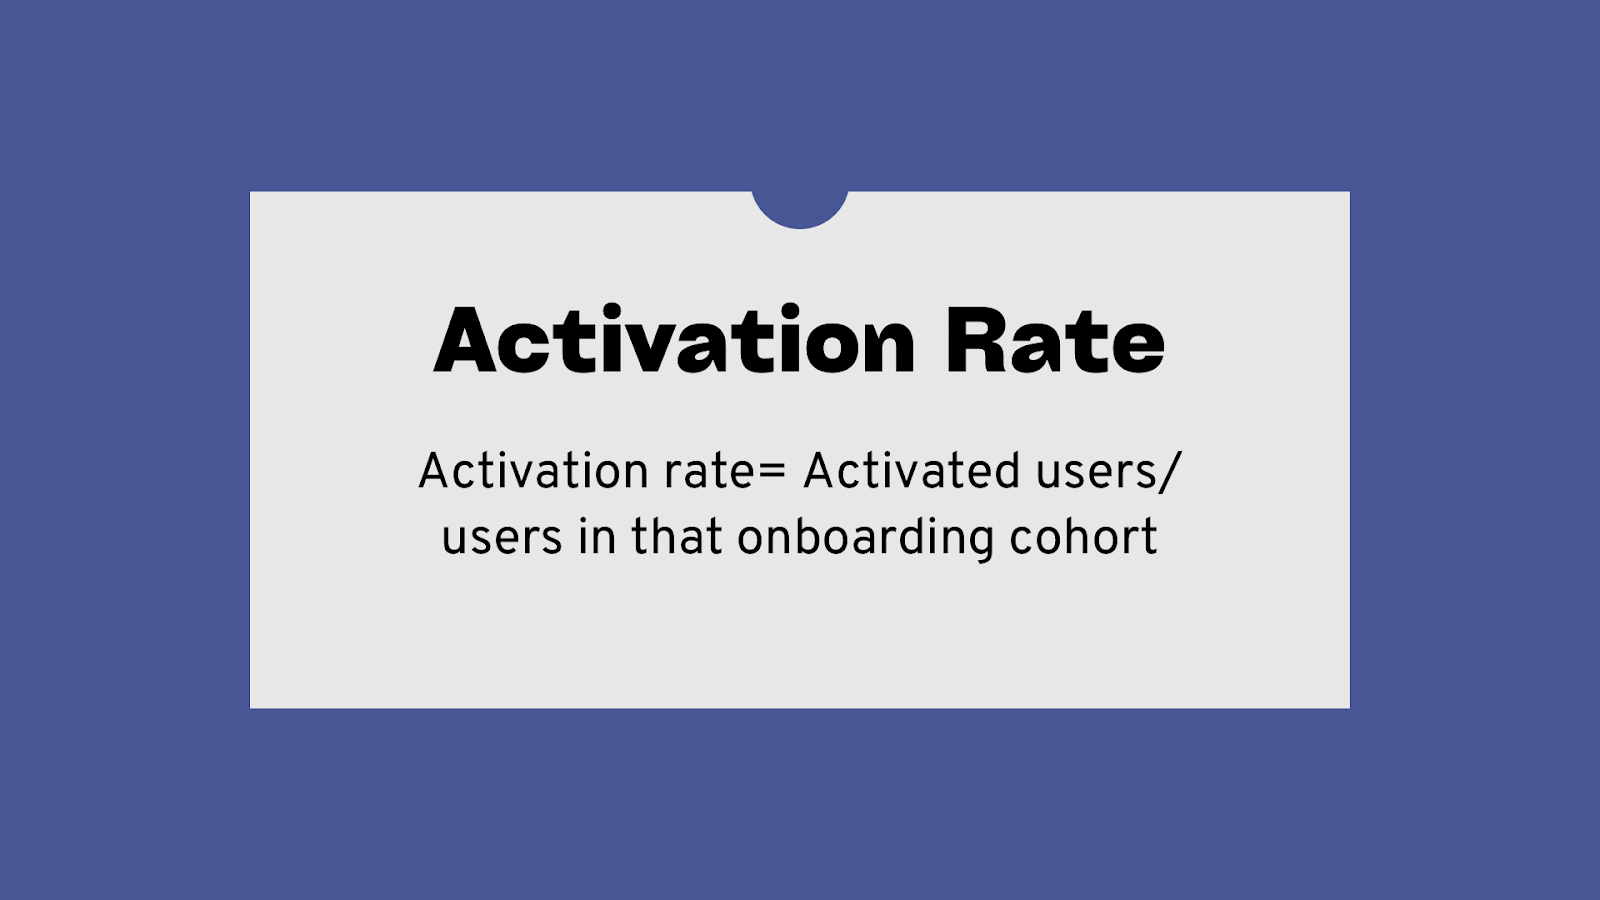
Activation rate
Activation rate measures the percentage of users who sign up for your product and take key actions that indicate long-term retention.
These actions could include:
- completing a tutorial,
- upgrading to a paid plan,
- or integrating with a third-party tool.
Identify the key actions that define activation for your product and track the percentage of users who complete these actions. Let’s say 200 users sign up in a month and 150 complete the tutorial; your activation rate is 75%.
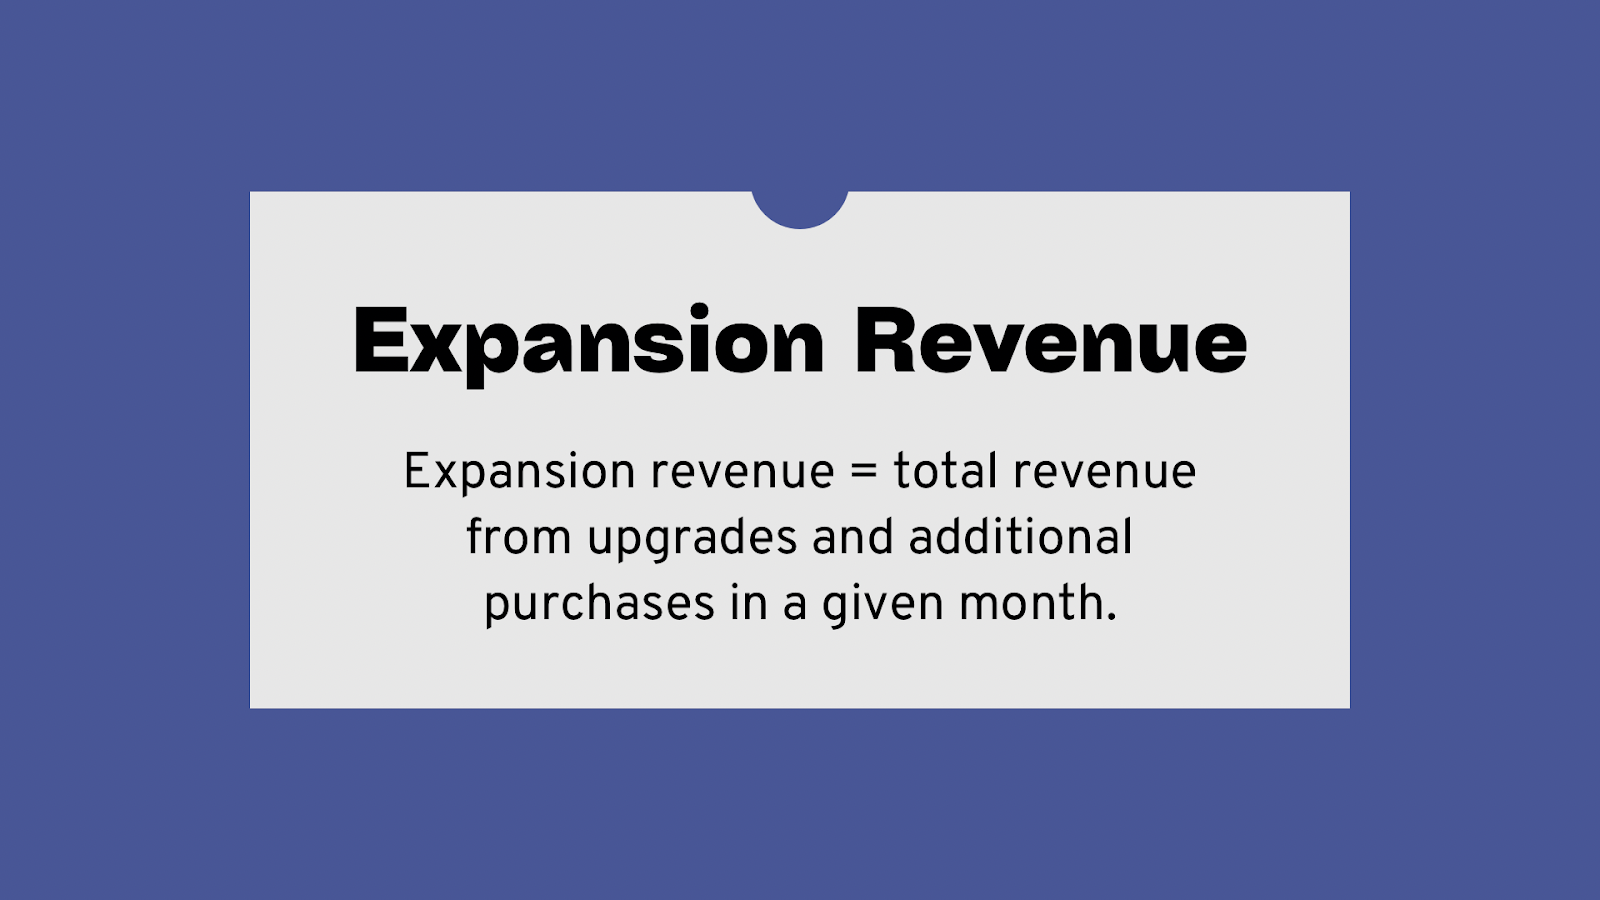
Expansion revenue
Expansion revenue, or expansion MRR, measures the revenue generated from existing customers through upsells, add-ons, and cross-sells.
It’s often more cost-effective to generate revenue from existing customers than to acquire new ones. Ideally, 30%+ of your revenue should be attributed to expansion revenue.
To measure your expansion rate, track the total revenue from upgrades and additional purchases in a given month. Say your total revenue from upgrades and additional purchases in a month is $50,000. This is your expansion revenue.
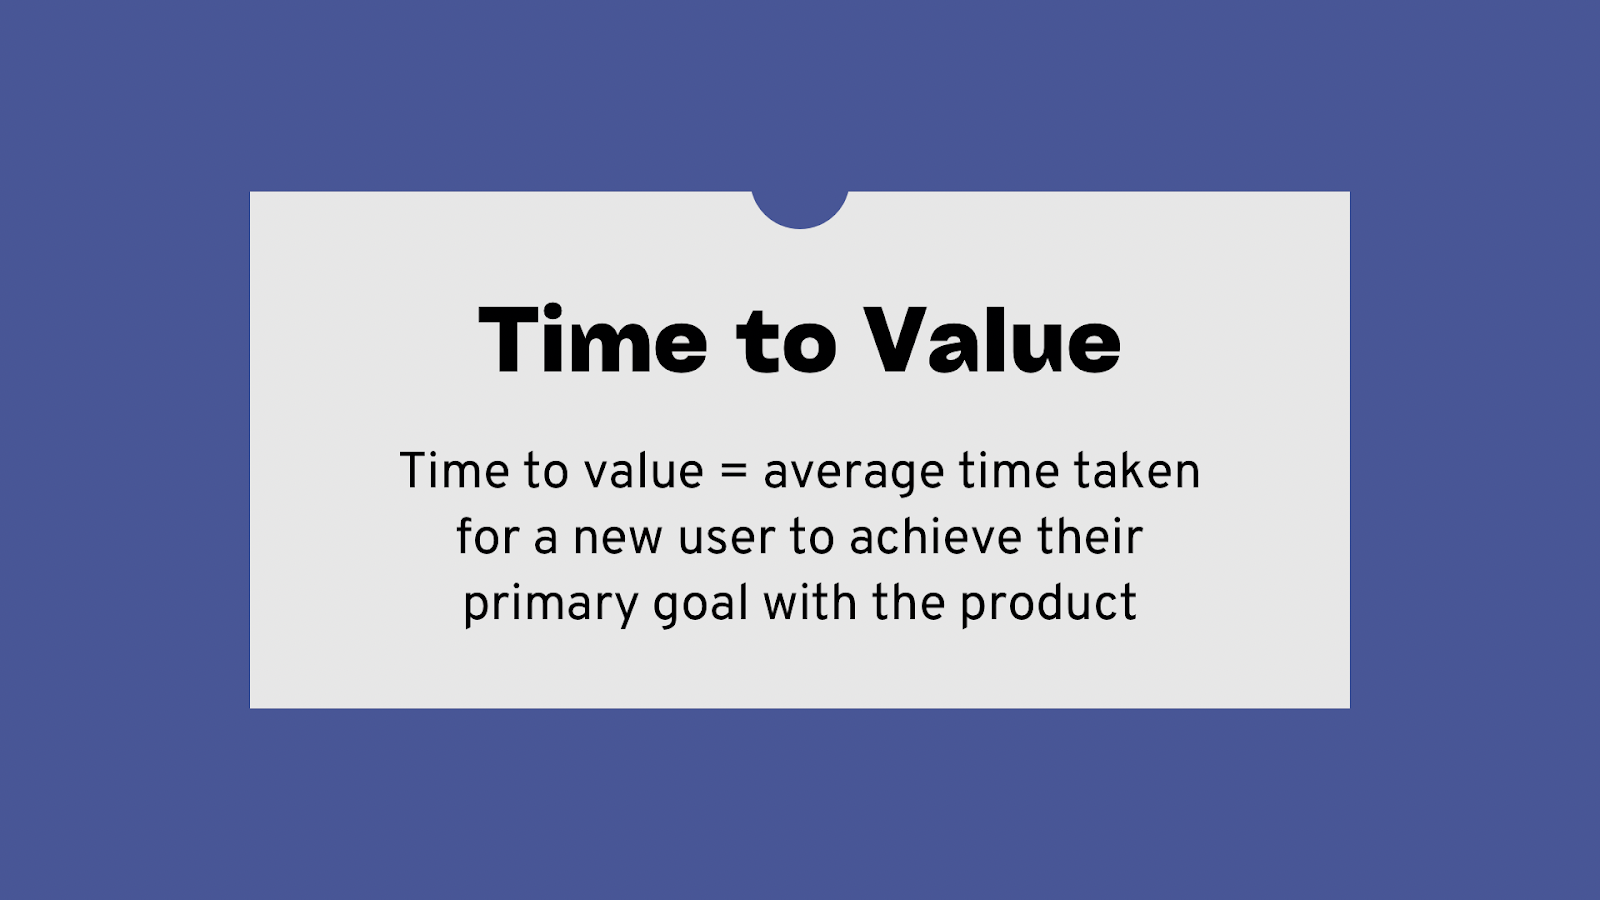
Time to Value
Time to value (TTV) is the time it takes new users to reach their first 'aha' moment or activation event. Depending on the complexity of the product, TTV can be immediate (short TTV) or long.
A shorter TTV means users achieve value faster, which can lead to higher retention. Assess the average time it takes for a new user to achieve their primary goal with the product.
Net Promoter Score (NPS)
Net Promoter Score (NPS) measures customer satisfaction by asking users how likely they are to recommend your product on a scale from 1 to 10.
NPS scores are categorized as follows:
- Promoters (9-10): These are enthusiastic users who are likely to recommend your product and become brand advocates.
- Passives (7-8): These are satisfied users, but they might not be highly engaged.
- Detractors (0-6): These are unhappy users who could churn and negatively impact your brand image.
To Calculate NPS, subtract the percentage of detractors from the percentage of promoters. High NPS scores indicate a strong product-market fit and positive word-of-mouth growth, which are hallmarks of PLG success.
Customer Acquisition Cost (CAC)
Customer Acquisition Cost (CAC) tells you how much it costs to acquire a new customer. An easy way to get this is to divide total sales and marketing expenses by the number of new customers acquired.
To measure CAC, track total sales and marketing expenses and divide by the number of paying customers acquired. Say your total sales and marketing expenses are $100,000, and you acquire 50 new customers. Your CAC is $2,000.
Number of support tickets
The number of support tickets during onboarding can give you an idea of how many users face difficulties and need assistance. A lower number of support tickets suggests a more intuitive user experience.
Monitor ticket volume over time and aim to reduce it through user experience optimizations and better product education. If your team usually receives 100 support tickets in a month, this is your baseline. A successful PLG strategy should reduce this number.
Real-Life examples of how companies measure product-led growth success
Bitly
According to Tara Robertson, Bitly's Chief Product Officer, the company is focused on growing its brand beyond short links. One of their fastest-growing products is QR codes, but Bitly is not well-known for this offering yet.
To measure success, the key metric they track is multi-product adoption, which gives insight into stickiness and net dollar retention.
Slack
Olivia Grace, Senior Director of Product Management at Slack, shared what Slack considers PLG success. She emphasized that Slack focuses on crafting exceptional product experiences to drive adoption rather than chasing specific growth metrics. During the peak of remote work, Slack released 'huddles' in 2021 to enable spontaneous collaboration that people missed from office environments. Huddles quickly became Slack's fastest-adopted feature ever.
Each week, millions of Slack users and over half of their paid customers use huddles, amounting to a combined 383 million minutes. On average, people join 4-5 short huddles per week, lasting around 11 minutes each. To drive further adoption, Slack has added functionality like video/screen sharing and delightful elements like customizable 'hold music' for waiting periods. Additionally, Slack hit a milestone of 700+ million daily messages sent on the platform’.
Setting Realistic Goals for Your PLG Strategy
Benchmark by Industry or Category: Research industry averages and competitor performance for key metrics like user acquisition costs, conversion rates, and churn rates. This provides a realistic benchmark for your product.
Say you’re launching an email marketing software for creatives, research the average CAC for similar SaaS products to set realistic targets.
Align with Business Goals: Choose metrics that best match your company’s stage, available tools, and current goals. Say your goal is to increase revenue and focus on user acquisition and conversion. If user engagement is the goal, track daily active users (DAU).
Gather and Analyze Data for PLG: Use analytics tools like Mixpanel or Amplitude to track user actions within your product. Capture events such as signups, feature usage, and time spent on different screens.
FAQs
How do you measure product-led growth?
You can measure the success of product-led growth through the tracking of product-led metrics. The key metrics among them include:
- User retention rate
- Activation rate
- Time-to-value
- Net Promoter Score
And many more!
What are product-led metrics?
Product metrics are data points that track how customers or users engage with your digital app or product, revealing the impact of those interactions on your business.
What are the main indicators of product-led growth?
The metrics you measure for PLG are encompassed under three main indicators, which are as follows:
Reach: Simply put, how many users are signing up to your product?
Activation: A successful strategy relies on users finding enough value in your product to become paying customers. It’s no good to having many users on your platform unless they’re offsetting your CAC cost
Engagement: How engaged are your active users. This gives you a good indication of whether users are finding that all-important value or not.
Like what you see? Why not check out exclusive insights from some of the leading minds in SaaS?
